
Same-sex marriage in California
Same-sex marriage has been legal in California since June 28, 2013. The state first allowed same-sex couples to marry from June 16, 2008, to November 5, 2008. This happened after the Supreme Court of California decided that not allowing same-sex couples to marry went against the Constitution of California.
However, this changed on November 5, 2008, when voters passed Proposition 8. This was a change to the state’s constitution that stopped same-sex marriages for a time. Even though new marriages were stopped, the ones that had already happened were still considered legal.
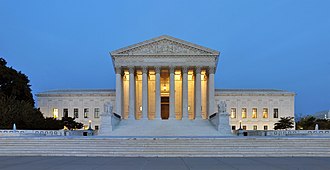
In 2013, the U.S. Supreme Court made a decision in the case Hollingsworth v. Perry. This decision allowed same-sex marriages to start again in California. In 2024, California voters passed Proposition 3. This made sure that the right to marry for same-sex and interracial couples was protected forever in the state’s constitution.
California was the second U.S. state to allow same-sex marriage, after Massachusetts. Even when California stopped allowing new same-sex marriages in 2008, it still recognized marriages from other places. Later, in 2008, Connecticut became the second state to issue same-sex marriage licenses.
History
See also: History of marriage in California and San Francisco 2004 same-sex weddings
In early 2004, officials in San Francisco began issuing marriage licenses to same-sex couples, even though it was not allowed by law. Many couples came from around the world to get married during this time. Later, the Supreme Court of California decided these marriages were not valid.
In 2008, the Supreme Court of California changed the law to allow same-sex couples to marry. This started on June 16, 2008. But in November 2008, voters passed Proposition 8, which changed the state’s rules again to stop same-sex marriages. The court later said the marriages that happened before Proposition 8 were still okay.
In 2013, the U.S. Supreme Court made a decision that allowed same-sex marriages to start again in California. This happened on June 28, 2013, and couples could get married once more.
Legislation
See also: Same-sex marriage legislation in the United States
Assembly Bill 607 (1977)
From 1971 to 1977, California law described marriage in a way that only included opposite-sex couples. To make this clearer, a bill called Assembly Bill 607 was passed in 1977. This bill, written by Assemblyman Bruce Nestande, changed the law to clearly state that marriage was only for a man and a woman. This happened because a couple in Orange County asked for a marriage license after laws changed in 1976. The bill became law in August 1977 and was later removed in 2015.
Proposition 22 (2000)
Main article: 2000 California Proposition 22
In 2000, California voters passed Proposition 22. This measure stated that only the union of a man and a woman was valid for marriage. It was approved by 61% of voters. However, in 2008, the California Supreme Court decided that this proposition was not valid.
Passage of same-sex marriage legislation (2005–2007)
In 2005, a bill to allow same-sex marriage was introduced but did not pass. Another bill was introduced in 2006 and passed in 2007, but the governor, Arnold Schwarzenegger, refused to sign it. He believed the issue should be decided by voters or the courts.
Proposition 8 (2008)
Main article: 2008 California Proposition 8
In 2008, a measure called Proposition 8 was put on the ballot. It aimed to change the state constitution to prevent same-sex couples from marrying. Voters approved it in November 2008. However, the California Supreme Court decided that existing same-sex marriages performed before this date remained valid.
The Marriage Recognition and Family Protection Act (2009)
In 2009, after Proposition 8 passed, Governor Schwarzenegger signed a law that recognized some same-sex marriages performed outside California as valid, depending on when they took place.
Senate Bill 1306 (2014)
In 2014, Senator Mark Leno introduced a bill to update marriage laws to include same-sex couples and remove old restrictions. The bill became law in 2015.
Proposition 3 (2024)
Main article: 2024 California Proposition 3
In 2024, California voters approved Proposition 3, which removed the restriction on same-sex marriage from the state constitution and stated that the right to marry is a fundamental right. The measure was approved by 62.6% of voters.
Court challenges
Trial court decision
In February 1993, a couple named Benjamin and Marcial Cable-McCarthy asked for a marriage license in Los Angeles, but it was turned down. They sued, but the case was stopped in 1993. Another couple, Arthur Smelt and Christopher Hammer, also sued but their case was turned down in 2005.
Several people and groups in California sued to change the state's marriage laws. In 2005, a judge decided that California’s rules limiting marriage to opposite-sex couples were not fair.
Appellate court decision
The state of California and some groups disagreed and took the case to a higher court. In 2006, that court decided the old rules could stay, saying it was up to voters, not judges, to change them.
Supreme Court of California review
In 2006, the case went to the California Supreme Court. In May 2008, the court decided that California’s marriage laws were unfair and needed to change. This meant same-sex couples could get married starting in June 2008.
Legal challenges to Proposition 8
After this decision, some people in California voted for Proposition 8, which tried to stop same-sex marriage again. In 2008, a court case was started to challenge this vote. In 2010, a judge decided Proposition 8 was unfair. In 2013, the U.S. Supreme Court decided the people who voted for Proposition 8 could not challenge the court’s decision, so same-sex marriage became legal again in California.
Main article: In re Marriage Cases
See also: Strauss v. Horton and Hollingsworth v. Perry
Legality of 2004 San Francisco marriages
In 2004, officials in San Francisco believed they could allow marriages for same-sex couples because they thought the state law against it was unfair. The mayor allowed these marriages to happen. But many people disagreed and went to court to stop it. The highest court in California told San Francisco to stop these marriages until they could decide if they were legal. Later, the court decided these marriages from 2004 were not legal.
Officials in nearby cities like Berkeley and Oakland wanted to do the same, but they couldn’t because marriage rules are handled by the whole county, not just one city. San Francisco could do its own thing because it is both a city and a county [/w/4].
Native American nations
California is home to many indigenous peoples, some of whom have traditions of two-spirit individuals. These individuals, born male, took on roles and clothing traditionally associated with women. This allowed marriages between two biological males or two biological females in some tribes.
Same-sex marriage is legal on the reservations of the Blue Lake Rancheria, the Colorado River Indian Tribes, and the Iipay Nation of Santa Ysabel. The Iipay Nation was the first in California to legalize same-sex marriage in June 2013, after a court decision. The Yurok Tribe has a marriage law that does not limit marriages to people of different genders, and the Karuk Tribe also has a similar law.
Demographics and marriage statistics
In the year 2000, about 92,000 couples in California were made up of two people of the same sex. By 2005, this number grew to about 108,000 couples. These couples lived in every part of the state, making up about 1% of all couples and homes. Most lived in Los Angeles, San Francisco, and San Diego, but San Francisco had the highest percentage of these couples.
In 2004, San Francisco gave out marriage papers to over 4,000 couples of the same sex before a court stopped them. Out of these, about 3,955 marriages were finished and recorded. Most of these couples were women, and many were older than 35 and had gone to college. Many couples lived in California, but some came from all over the United States and a few other countries.
Public opinion
Notes:
- 1 95% level of confidence, including the design effect for the survey of 1.56%
| Poll source | Dates administered | Sample size | Margin of error | Support | Opposition | Don't know / refused |
|---|---|---|---|---|---|---|
| Public Religion Research Institute | March 9 – December 7, 2023 | 2,162 adults | ± 0.82% 1 | 68% | 29% | 3% |
| Public Religion Research Institute | March 11–December 14, 2022 | ? | ? | 72% | 26% | 2% |
| Public Religion Research Institute | March 8–November 9, 2021 | ? | ? | 71% | 27% | 2% |
| Public Religion Research Institute | January 7–December 20, 2020 | 5,415 random telephone interviewees | ? | 75% | 22% | 3% |
| Public Religion Research Institute | April 5–December 23, 2017 | 7,260 random telephone interviewees | ? | 66% | 23% | 11% |
| Public Religion Research Institute | May 18, 2016–January 10, 2017 | 9,640 random telephone interviewees | ? | 66% | 24% | 10% |
| Public Religion Research Institute | April 29, 2015–January 7, 2016 | 7,671 random telephone interviewees | ? | 60% | 30% | 9% |
| Edison Research | November 4, 2014 | ? | ? | 61% | 35% | 4% |
| Public Policy Institute of California | October 12–19, 2014 | 1,704 adult residents | ± 3.5% | 56% | 36% | 8% |
| New York Times/CBS News/YouGov | September 20–October 1, 2014 | 7,943 likely voters | ± 1.6% | 58% | 32% | 12% |
| Public Religion Research Institute | April 2, 2014–January 4, 2015 | 4,506 random telephone interviewees | ? | 61% | 31% | 8% |
| Public Religion Research Institute | November 12–December 18, 2013 | 408 random telephone interviewees | ± 5.6% | 59% | 37% | 5% |
| Public Policy Institute of California | September 10–17, 2013 | 1,703 adult residents | ± 3.7% | 61% | 34% | 5% |
| 1,102 likely voters | ± 4.5% | 64% | 32% | 4% | ||
| Public Policy Institute of California | May 14–20, 2013 | 1,704 adult residents | ± 3.8% | 56% | 38% | 6% |
| 1,129 likely voters | ± 4.6% | 59% | 36% | 5% | ||
| Field Poll | February 5–17, 2013 | 834 adults | ± 4.2% | 61% | 32% | 7% |
| Public Policy Institute of California | January 15–22, 2013 | 1,704 adult residents | ± 3.5% | 53% | 41% | 6% |
| 1,116 likely voters | ± 4.2% | 54% | 40% | 5% | ||
| Public Policy Institute of California | May 14–20, 2012 | 894 likely voters | ± 3.5% | 56% | 37% | 7% |
| Public Policy Institute of California | February 21–28, 2012 | 2,001 adult residents | ± 3.4% | 52% | 41% | 6% |
| 859 likely voters | ± 4.2% | 56% | 38% | 6% | ||
| Field Poll | February 2–18, 2012 | 1,003 adults | ± 4.5% | 59% | 34% | 7% |
| Public Policy Polling | November 10–13, 2011 | 500 voters | ± 4.4% | 48% | 43% | 9% |
| Public Policy Institute of California | September 6–13, 2011 | 2,002 adult residents | ± 3.6% | 53% | 42% | 5% |
| 958 likely voters | ± 4.2% | 53% | 42% | 4% | ||
| Public Policy Polling | January 28–30, 2011 | 892 voters | ± 3.3% | 51% | 40% | 10% |
| Public Policy Polling | September 14–16, 2010 | 630 likely voters | ± 3.9% | 46% | 44% | 10% |
| Field Poll | June 22–July 5, 2010 | 1,390 adults | ± 2.8% | 51% | 42% | 7% |
| Public Policy Institute of California | March 9–16, 2010 | 2,002 adult residents | ± 2% | 50% | 45% | 5% |
| 1,102 likely voters | ± 3% | 49% | 45% | 6% | ||
| Public Policy Institute of California | March 10–17, 2009 | 2,004 adult residents | ± 2% | 44% | 49% | 7% |
| 987 likely voters | ± 3% | 45% | 49% | 6% | ||
| Field Poll | February 20–March 1, 2009 | 761 adults | ± 3.6% | 49% | 44% | 7% |
| Public Policy Institute of California | November 5–16, 2008 | 2,003 adult residents | ± 2% | 47% | 48% | 5% |
| Public Policy Institute of California | October 12–19, 2008 | 2,004 adult residents | ± 2% | 44% | 50% | 6% |
| Public Policy Institute of California | August 12–19, 2008 | 2,001 adult residents | ± 2% | 45% | 48% | 7% |
| 1,047 likely voters | ± 3% | 47% | 47% | 6% | ||
| Field Poll | May 17–26, 2008 | 1,052 adults | ± 3.2% | 51% | 42% | 7% |
| Public Policy Institute of California | June 12–19, 2007 | 2,003 adult residents | ± 2% | 45% | 49% | 6% |
| 983 likely voters | ± 3% | 46% | 48% | 6% | ||
| Public Policy Institute of California | September 13–20, 2006 | 2,003 adult residents | ± 2% | 44% | 48% | 8% |
| 1091 likely voters | ± 3% | 47% | 46% | 7% | ||
| Field Poll | February 12–26, 2006 | 1,000 adults | ± 3.2% | 43% | 51% | 6% |
| Field Poll | 2006 | ? | ? | 44% | 50% | 6% |
| Public Policy Institute of California | August 8–15, 2005 | 2,004 adult residents | ± 2% | 44% | 48% | 8% |
| 988 likely voters | ± 3% | 46% | 46% | 8% | ||
| Field Poll | May 18–24, 2004 | 745 adults | ± 5.2% | 43% | 53% | 4% |
| Field Poll | February 18–22, 2004 | 958 adults | ± 3.3% | 44% | 50% | 6% |
| Public Policy Institute of California | February 8–16, 2004 | 2,004 adult residents | ± 2% | 44% | 50% | 6% |
| 1,013 likely voters | ± 3% | 43% | 51% | 6% | ||
| Field Poll | August 10–13, 2003 | 1,036 adults | ± 5.8% | 42% | 50% | 8% |
| Public Policy Institute of California | January 2–10, 2000 | 1,031 likely voters | ± 3.5% | 38% | 55% | 7% |
| Field Poll | February 11–17, 1997 | 1,045 adults | ± 3.3% | 38% | 56% | 6% |
| Field Poll | 1997 | ? | ? | 39% | 55% | 6% |
| Field Poll | 1985 | ? | ? | 30% | 62% | 8% |
| Field Poll | 1977 | ? | ? | 28% | 59% | 13% |
Timeline
- February 12, 2004: Mayor Gavin Newsom and other city officials in San Francisco started giving marriage licenses to same-sex couples. Del Martin and Phyllis Lyon were the first couple to be married.
- June 16, 2008: Same-sex marriage became legal in California. Counties began giving marriage licenses to same-sex couples.
- November 4, 2008: Voters passed Proposition 8, which stopped same-sex marriages from being legal.
- June 28, 2013: Same-sex marriages became legal again in California after a court decision. The first marriages since 2008 took place that day.
Pictures
Keep exploring




This article is a child-friendly adaptation of the Wikipedia article on Same-sex marriage in California, available under CC BY-SA 4.0.
Images from Wikimedia Commons. Tap any image to view credits and license.