 Safekipedia
Demographics of Germany
Adapted from Wikipedia · Discoverer experience
The demography of Germany is monitored by the Statistisches Bundesamt (Federal Statistical Office of Germany). As of December 31, 2024, Germany has a population of 83,577,140, making it the most populous country in the European Union and the nineteenth-most populous country in the world. The total fertility rate in 2023 was 1.38, which is below the replacement rate of 2.1. Because of this low birth rate, Germany has had more deaths than births every year since 1972. However, immigration has helped the population grow over the last fifty years.
Historically, Germany was a country where many people moved abroad, especially to the US in the 19th century. But after World War II, more people moved to Germany than left. This included ethnic Germans who were expelled from Eastern Europe, as well as many workers from Southern Europe during a time of strong economic growth. Later waves of immigration included people seeking safety during conflicts and after the expansion of the European Union.
Today, Germany is known for its high education levels, technology, and strong economy. The country provides important services like universal health care and child benefits for families. However, like many places, Germany faces challenges with an aging population and changes in its economy.
| Year | Pop. | ±% p.a. |
|---|---|---|
| 1500 | 9,200,000 | — |
| 1550 | 12,900,000 | +0.68% |
| 1600 | 16,200,000 | +0.46% |
| 1650 | 10,000,000 | −0.96% |
| 1700 | 14,100,000 | +0.69% |
| 1750 | 18,300,000 | +0.52% |
| 1800 | 22,700,000 | +0.43% |
| 1850 | 35,303,000 | +0.89% |
| 1870 | 40,804,000 | +0.73% |
| 1900 | 56,046,000 | +1.06% |
| 1910 | 64,568,000 | +1.43% |
| 1920 | 61,974,000 | −0.41% |
| 1930 | 64,294,000 | +0.37% |
| 1940 | 69,838,000 | +0.83% |
| 1950 | 69,346,000 | −0.07% |
| 1960 | 73,147,000 | +0.54% |
| 1970 | 78,069,000 | +0.65% |
| 1980 | 78,397,000 | +0.04% |
| 1990 | 79,753,227 | +0.17% |
| 2000 | 82,259,540 | +0.31% |
| 2010 | 81,751,602 | −0.06% |
| 2020 | 83,155,031 | +0.17% |
| 2024 | 83,577,140 | +0.13% |
| Source: DESTATIS (after 1950), Histat (1850−1940 Reich Boundaries), Max Planck Society (1500−1840 Reich Boundaries (incl .Als.-Lor.)) | ||
History
1945–1990
After World War II, many people moved from places in Central and Eastern Europe and from former eastern areas of Germany to the western parts of the country. During the time when Germany was divided, many people from East Germany moved to West Germany for better lives. Since Germany reunited, people have been moving from the eastern areas to the western areas for job opportunities.
The two parts of Germany, the Federal Republic and the German Democratic Republic, had different ways of handling families and having children. In East Germany, having children was encouraged more, and there was free childcare for all mothers.
1990–today
Main article: New states of Germany
Since Germany reunited, many people, especially young women, have moved from the eastern states to the western states. The number of children being born in the eastern states dropped a lot at first but has been getting closer to the numbers in the western states.
Family policies have changed over time. In 2007, a new system was introduced to help families with children. In recent years, more fathers are taking time off work to help care for newborn babies, and more mothers are working. The number of children being born to educated women has also gone up.
Some studies suggest that if current trends continue, the average income in Germany might decrease by the year 2040 because there will be fewer people working compared to those who need care, like older people and children.
Population
Further information: Census in Germany
Germany has a large population, with over 83 million people as of the end of 2024. This makes it the most populous country in the European Union. The country counts its people using special checks every ten years, a process required by the European Union.
The number of children born to women in Germany is lower than needed to keep the population the same size. This number, called the fertility rate, was about 1.38 in 2023.
People in Germany live to about 80 years on average. Women tend to live a little longer than men. About one in four people in Germany is 65 years old or older. The country's median age is around 47 years, making it one of the older populations in the world.
Main article: List of German states by life expectancy
| Year | Fertility |
|---|---|
| 1800 | 5.4 |
| 1801 | 5.40 |
| 1802 | 5.39 |
| 1803 | |
| 1804 | 5.38 |
| 1805 | |
| 1806 | 5.37 |
| 1807 | |
| 1808 | 5.36 |
| 1809 | |
| 1810 | 5.35 |
| 1811 | |
| 1812 | 5.34 |
| 1813 | |
| 1814 | 5.33 |
| 1815 | |
| 1816 | 5.32 |
| 1817 | |
| 1818 | 5.33 |
| 1819 | 5.35 |
| 1820 | 5.37 |
| 1821 | 5.35 |
| 1822 | 5.33 |
| 1823 | 5.31 |
| 1824 | 5.28 |
| 1825 | 5.26 |
| 1826 | 5.17 |
| 1827 | 5.07 |
| 1828 | 4.97 |
| 1829 | 4.88 |
| 1830 | 4.78 |
| 1831 | 4.80 |
| 1832 | 4.83 |
| 1833 | 4.85 |
| 1834 | 4.88 |
| 1835 | 4.9 |
| 1836 | |
| 1837 | |
| 1838 | |
| 1839 | |
| 1840 | |
| 1841 | |
| 1842 | 4.95 |
| 1843 | 4.97 |
| 1844 | 5.00 |
| 1845 | 5.02 |
| 1846 | |
| 1847 | |
| 1848 | 5.01 |
| 1849 | |
| 1850 | |
| 1851 | 4.87 |
| 1852 | 4.74 |
| 1853 | 4.60 |
| 1854 | 4.47 |
| 1855 | 4.33 |
| 1856 | 4.45 |
| 1857 | 4.56 |
| 1858 | 4.67 |
| 1859 | 4.79 |
| 1860 | 4.90 |
| 1861 | 4.93 |
| 1862 | 4.96 |
| 1863 | 5.00 |
| 1864 | 5.03 |
| 1865 | 5.06 |
| 1866 | 5.09 |
| 1867 | 5.11 |
| 1868 | 5.13 |
| 1869 | 5.16 |
| 1870 | 5.18 |
| 1871 | 5.24 |
| 1872 | 5.30 |
| 1873 | 5.35 |
| 1874 | 5.41 |
| 1875 | 5.46 |
| 1876 | 5.38 |
| 1877 | 5.30 |
| 1878 | 5.22 |
| 1879 | 5.14 |
| 1880 | 5.06 |
| 1881 | 5.14 |
| 1882 | 5.21 |
| 1883 | 5.29 |
| 1884 | 5.28 |
| 1885 | 5.26 |
| 1886 | 5.25 |
| 1887 | 5.23 |
| 1888 | 5.22 |
| 1889 | 5.21 |
| 1890 | 5.20 |
| 1891 | 5.18 |
| 1892 | 5.17 |
| 1893 | 5.16 |
| 1894 | 5.14 |
| 1895 | 5.11 |
| 1896 | 5.09 |
| 1897 | 5.06 |
| 1898 | 5.04 |
| 1899 | 4.99 |
| Year | Life expectancy |
|---|---|
| 1875 | 38.5 |
| 1885 | 39.5 |
| 1895 | 42.8 |
| 1905 | 45.5 |
| 1911 | 49.0 |
| 1915 | 40.5 |
| 1925 | 57.4 |
| 1935 | 61.5 |
| 1946 | 60.5 |
| Period | Life expectancy |
|---|---|
| 1950–1955 | 67.5 |
| 1955–1960 | 68.9 |
| 1960–1965 | 70.0 |
| 1965–1970 | 70.7 |
| 1970–1975 | 71.2 |
| 1975–1980 | 72.3 |
| 2010–2015 | 80.4 |
| 1980–1985 | 73.7 |
| 1985–1990 | 75.0 |
| 1990–1995 | 76.0 |
| 2000–2005 | 78.6 |
| 2005–2010 | 79.7 |
| 2010–2015 | 80.4 |
| 2015–2020 | 81.1 |
| 2015–2020 | 81.1 |
Vital statistics
Germany has kept track of its population since 1817. Over time, the country’s borders changed, especially in 1866, 1871, 1918/1919, 1921/1922, 1945/1946, and 1990. Some events, like wars and diseases, affected how many people lived there.
In 2023, most children born in Germany — about 500,670 — had mothers who were German citizens. Many other children were born to mothers from other European countries or from places outside of Europe.
The number of babies born each year is lower than what’s needed to keep the population the same size, meaning Germany’s population may change in the future.
| Year | Average population | Live births | Deaths | Natural change | Crude birth rate (per 1000) | Crude death rate (per 1000) | Natural change (per 1000) | Crude migration change (per 1000) | Total fertility rates | ||
|---|---|---|---|---|---|---|---|---|---|---|---|
| All of Germany | FRG | (Former) GDR | |||||||||
| 1817 | 25,009,000 | 987,856 | 675,243 | 312,613 | 39.5 | 27.0 | 12.5 | 5.32 | |||
| 1818 | 25,369,000 | 1,002,076 | 687,500 | 314,576 | 39.5 | 27.1 | 12.4 | 2.0 | 5.33 | ||
| 1819 | 25,733,000 | 1,067,920 | 717,951 | 349,969 | 41.5 | 27.9 | 13.6 | 0.7 | 5.35 | ||
| 1820 | 26,101,000 | 1,041,430 | 636,864 | 404,566 | 39.9 | 24.4 | 15.5 | −1.2 | 5.37 | ||
| 1821 | 26,473,000 | 1,080,098 | 606,232 | 473,867 | 40.8 | 22.9 | 17.9 | −3.6 | 5.35 | ||
| 1822 | 26,851,000 | 1,065,985 | 660,535 | 405,450 | 39.7 | 24.6 | 15.1 | −0.8 | 5.33 | ||
| 1823 | 27,217,000 | 1,056,020 | 666,817 | 389,203 | 38.8 | 24.5 | 14.3 | −0.7 | 5.31 | ||
| 1824 | 27,571,000 | 1,064,241 | 667,218 | 397,022 | 38.6 | 24.2 | 14.4 | −1.4 | 5.28 | ||
| 1825 | 27,930,000 | 1,092,063 | 684,285 | 407,778 | 39.1 | 24.5 | 14.6 | −1.6 | 5.26 | ||
| 1826 | 28,259,000 | 1,099,275 | 737,560 | 361,715 | 38.9 | 26.1 | 12.8 | −1.0 | 5.17 | ||
| 1827 | 28,558,000 | 1,030,944 | 753,931 | 277,013 | 36.1 | 26.4 | 9.7 | 0.9 | 5.07 | ||
| 1828 | 28,863,000 | 1,041,954 | 767,756 | 274,199 | 36.1 | 26.6 | 9.5 | 1.2 | 4.97 | ||
| 1829 | 29,143,000 | 1,028,748 | 810,175 | 218,573 | 35.3 | 27.8 | 7.5 | 2.2 | 4.88 | ||
| 1830 | 29,392,000 | 1,043,416 | 805,341 | 238,075 | 35.5 | 27.4 | 8.1 | 0.4 | 4.78 | ||
| 1831 | 29,642,000 | 1,037,047 | 901,117 | 136,353 | 35.0 | 30.4 | 4.6 | 3.9 | 4.80 | ||
| 1832 | 29,906,000 | 1,019,795 | 864,283 | 155,511 | 34.1 | 28.9 | 5.2 | 3.7 | 4.83 | ||
| 1833 | 30,185,000 | 1,107,790 | 860,273 | 247,517 | 36.7 | 28.2 | 8.2 | 1.1 | 4.85 | ||
| 1834 | 30,467,000 | 1,145,559 | 895,730 | 249,829 | 37.6 | 29.4 | 8.2 | 1.1 | 4.88 | ||
| 1835 | 30,802,000 | 1,121,193 | 807,012 | 314,180 | 36.4 | 26.2 | 10.2 | 0.8 | 4.90 | ||
| 1836 | 31,129,000 | 1,142,434 | 806,241 | 336,193 | 36.7 | 25.9 | 10.8 | −0.2 | 4.90 | ||
| 1837 | 31,455,000 | 1,141,817 | 915,341 | 226,476 | 36.3 | 29.1 | 7.2 | 3.3 | 4.90 | ||
| 1838 | 31,824,000 | 1,155,211 | 827,424 | 327,787 | 36.3 | 26.0 | 10.3 | 1.4 | 4.90 | ||
| 1839 | 32,223,000 | 1,172,917 | 876,466 | 296,452 | 36.4 | 27.2 | 9.2 | 3.3 | 4.90 | ||
| 1840 | 32,621,000 | 1,187,404 | 864,457 | 322,948 | 36.4 | 26.5 | 9.9 | 2.5 | 4.90 | ||
| 1841 | 32,979,000 | 1,201,587 | 864,075 | 337,512 | 36.4 | 26.2 | 10.2 | 0.8 | 4.92 | ||
| 1842 | 33,298,000 | 1,251,102 | 902,529 | 348,573 | 37.6 | 27.1 | 10.5 | −0.8 | 4.95 | ||
| 1843 | 33,605,000 | 1,209,762 | 905,608 | 304,154 | 36.0 | 26.9 | 9.1 | 0.1 | 4.97 | ||
| 1844 | 33,922,000 | 1,216,429 | 830,345 | 386,084 | 35.9 | 24.5 | 11.4 | −2.0 | 5.00 | ||
| 1845 | 34,284,000 | 1,278,286 | 867,729 | 410,557 | 37.3 | 25.3 | 12.0 | −1.3 | 5.02 | ||
| 1846 | 34,610,000 | 1,244,369 | 939,436 | 304,933 | 36.0 | 27.1 | 8.8 | 0.7 | 5.02 | ||
| 1847 | 34,784,000 | 1,156,820 | 983,981 | 172,839 | 33.3 | 28.3 | 5.0 | 0 | 5.02 | ||
| 1848 | 34,839,000 | 1,160,533 | 1,011,954 | 148,579 | 33.3 | 29.0 | 4.3 | −2.7 | 5.01 | ||
| 1849 | 35,004,000 | 1,333,379 | 947,476 | 385,903 | 38.1 | 27.1 | 11.0 | −6.3 | 5.01 | ||
| 1850 | 35,303,000 | 1,311,726 | 903,521 | 408,203 | 37.2 | 25.6 | 11.6 | −3.1 | 5.01 | ||
| 1851 | 35,620,000 | 1,306,877 | 889,601 | 417,276 | 36.7 | 25.0 | 11.7 | −2.7 | 4.87 | ||
| 1852 | 35,858,000 | 1,271,446 | 1,018,135 | 253,311 | 35.5 | 28.4 | 7.1 | −0.4 | 4.74 | ||
| 1853 | 35,989,000 | 1,244,192 | 978,650 | 265,542 | 34.6 | 27.2 | 7.4 | −3.7 | 4.60 | ||
| 1854 | 35,923,000 | 1,226,769 | 972,726 | 254,043 | 34.0 | 27.0 | 6.9 | −8.7 | 4.47 | ||
| 1855 | 36,136,000 | 1,162,945 | 1,016,284 | 146,661 | 32.2 | 28.1 | 4.1 | 1.8 | 4.33 | ||
| 1856 | 36,257,000 | 1,215,390 | 913,913 | 301,477 | 33.5 | 25.2 | 8.3 | −5.0 | 4.45 | ||
| 1857 | 36,524,000 | 1,315,034 | 991,753 | 323,281 | 36.0 | 27.2 | 8.9 | −1.5 | 4.56 | ||
| 1858 | 36,828,000 | 1,354,817 | 985,176 | 368,641 | 36.8 | 26.8 | 10.0 | −1.7 | 4.67 | ||
| 1859 | 37,188,000 | 1,393,339 | 956,924 | 436,415 | 37.5 | 25.7 | 11.7 | −1.9 | 4.79 | ||
| 1860 | 37,609,000 | 1,367,012 | 873,364 | 493,648 | 36.3 | 23.2 | 13.1 | −1.8 | 4.90 | ||
| 1861 | 38,001,000 | 1,357,355 | 972,989 | 384,366 | 35.7 | 25.6 | 10.1 | 0.3 | 4.93 | ||
| 1862 | 38,360,000 | 1,358,896 | 945,530 | 413,366 | 35.4 | 24.6 | 10.8 | −1.4 | 4.96 | ||
| 1863 | 38,763,000 | 1,454,340 | 996,193 | 458,147 | 37.5 | 25.7 | 11.8 | −1.3 | 5.00 | ||
| 1864 | 39,187,000 | 1,481,778 | 1,027,756 | 454,022 | 37.8 | 26.2 | 11.6 | −0.7 | 5.03 | ||
| 1865 | 39,545,000 | 1,488,620 | 1,091,419 | 397,201 | 37.6 | 27.6 | 10.0 | −0.9 | 5.06 | ||
| 1866 | 39,765,000 | 1,505,287 | 1,217,591 | 287,696 | 37.8 | 30.6 | 7.2 | −1.6 | 5.09 | ||
| 1867 | 40,031,000 | 1,471,747 | 1,045,534 | 426,213 | 36.8 | 26.1 | 10.6 | −3.9 | 5.11 | ||
| 1868 | 40,223,000 | 1,481,727 | 1,110,620 | 371,107 | 36.8 | 27.6 | 9.2 | −4.4 | 5.13 | ||
| 1869 | 40,493,000 | 1,529,387 | 1,089,503 | 439,884 | 37.8 | 26.9 | 10.9 | −4.2 | 5.16 | ||
| 1870 | 40,804,000 | 1,569,206 | 1,117,875 | 451,331 | 38.5 | 27.4 | 11.1 | −3.4 | 5.18 | ||
| 1871 | 40,997,000 | 1,414,248 | 1,212,869 | 201,379 | 34.5 | 29.6 | 4.9 | −0.2 | 4.47 | ||
| 1872 | 41,230,000 | 1,626,037 | 1,194,732 | 431,305 | 39.5 | 29.0 | 10.5 | −4.8 | 5.11 | ||
| 1873 | 41,564,000 | 1,648,117 | 1,174,293 | 473,824 | 39.7 | 28.3 | 11.4 | −3.3 | 5.17 | ||
| 1874 | 42,004,000 | 1,683,440 | 1,122,396 | 561,044 | 40.1 | 26.7 | 13.4 | −2.8 | 5.24 | ||
| 1875 | 42,518,000 | 1,724,412 | 1,172,393 | 552,019 | 40.6 | 27.6 | 13.0 | −0.8 | 5.34 | ||
| 1876 | 43,059,000 | 1,761,046 | 1,134,452 | 626,594 | 40.9 | 26.3 | 14.6 | −1.9 | 5.42 | ||
| 1877 | 43,610,000 | 1,744,659 | 1,152,023 | 592,636 | 40.0 | 26.4 | 13.6 | −0.8 | 5.34 | ||
| 1878 | 44,135,000 | 1,716,852 | 1,156,337 | 560,515 | 35.5 | 28.4 | 12.7 | −0.7 | 5.20 | ||
| 1879 | 44,655,000 | 1,737,080 | 1,143,168 | 593,912 | 38.9 | 26.2 | 12.5 | −0.7 | 5.22 | ||
| 1880 | 45,095,000 | 1,696,175 | 1,173,205 | 522,970 | 37.6 | 26.0 | 11.6 | −1.7 | 5.05 | ||
| 1881 | 45,426,000 | 1,682,649 | 1,156,391 | 525,758 | 37.0 | 25.5 | 11.5 | −4.2 | 4.98 | ||
| 1882 | 45,717,000 | 1,702,348 | 1,176,853 | 525,495 | 37.2 | 25.7 | 11.5 | −5.1 | 5.01 | ||
| 1883 | 46,014,000 | 1,683,699 | 1,190,002 | 493,697 | 36.6 | 25.9 | 10.7 | −4.2 | 4.92 | ||
| 1884 | 46,335,000 | 1,725,583 | 1,203,500 | 522,083 | 37.2 | 26.0 | 11.3 | −4.3 | 5.02 | ||
| 1885 | 46,705,000 | 1,729,927 | 1,199,742 | 530,185 | 37.0 | 25.7 | 11.4 | −3.4 | 4.99 | ||
| 1886 | 47,103,000 | 1,746,133 | 1,233,737 | 512,396 | 37.1 | 26.2 | 10.9 | −2.4 | 4.99 | ||
| 1887 | 47,540,000 | 1,757,079 | 1,151,924 | 605,155 | 36.9 | 24.2 | 12.7 | −3.4 | 4.96 | ||
| 1888 | 48,020,000 | 1,761,407 | 1,142,826 | 618,581 | 36.6 | 23.7 | 12.9 | −2.8 | 4.92 | ||
| 1889 | 48,512,000 | 1,772,570 | 1,153,087 | 619,483 | 36.4 | 23.7 | 12.8 | −2.6 | 4.88 | ||
| 1890 | 49,239,000 | 1,759,253 | 1,199,006 | 560,247 | 35.7 | 24.4 | 11.4 | 3.6 | 4.78 | ||
| 1891 | 49,767,000 | 1,840,172 | 1,164,421 | 675,751 | 37.0 | 23.4 | 13.6 | −2.9 | 4.92 | ||
| 1892 | 50,279,000 | 1,795,971 | 1,211,402 | 584,569 | 35.7 | 24.1 | 11.6 | −1.3 | 4.73 | ||
| 1893 | 50,778,000 | 1,865,715 | 1,248,201 | 617,514 | 36.8 | 24.6 | 12.2 | −2.3 | 4.83 | ||
| 1894 | 51,339,000 | 1,841,205 | 1,144,331 | 696,874 | 35.9 | 22.3 | 13.6 | −2.6 | 4.70 | ||
| 1895 | 52,001,000 | 1,877,278 | 1,151,488 | 725,790 | 36.1 | 22.1 | 14.0 | −1.1 | 4.71 | ||
| 1896 | 52,753,000 | 1,914,749 | 1,098,966 | 815,783 | 36.3 | 20.8 | 15.5 | −1.0 | 4.72 | ||
| 1897 | 53,549,000 | 1,926,690 | 1,142,056 | 784,634 | 36.1 | 21.3 | 14.7 | 0.4 | 4.67 | ||
| 1898 | 54,406,000 | 1,964,731 | 1,117,860 | 846,871 | 36.1 | 20.5 | 15.6 | 0.4 | 4.69 | ||
| 1899 | 55,248,000 | 1,980,304 | 1,185,197 | 795,107 | 35.9 | 21.5 | 14.4 | 1.1 | 4.66 | ||
| 1900 | 56,046,000 | 1,996,139 | 1,236,382 | 759,757 | 35.6 | 22.1 | 13.6 | 0.8 | 4.63 | ||
| 1901 | 56,874,000 | 2,032,313 | 1,174,489 | 857,824 | 35.7 | 20.7 | 15.0 | −0.2 | 4.65 | ||
| 1902 | 57,767,000 | 2,024,735 | 1,122,492 | 902,243 | 35.1 | 19.4 | 15.7 | 0 | 4.56 | ||
| 1903 | 58,629,000 | 1,983,078 | 1,170,905 | 812,173 | 33.8 | 20.0 | 13.8 | 1.1 | 4.40 | ||
| 1904 | 59,475,000 | 2,025,847 | 1,163,183 | 862,664 | 34.0 | 19.6 | 14.5 | −0.1 | 4.42 | ||
| 1905 | 60,314,000 | 1,987,153 | 1,194,314 | 792,839 | 33.0 | 19.8 | 13.1 | 1.0 | 4.27 | ||
| 1906 | 61,153,000 | 2,022,477 | 1,112,202 | 910,275 | 33.1 | 18.2 | 14.9 | −1.0 | 4.28 | ||
| 1907 | 62,013,000 | 1,999,933 | 1,117,309 | 882,624 | 32.3 | 18.0 | 14.2 | −0.1 | 4.18 | ||
| 1908 | 62,863,000 | 2,015,052 | 1,135,490 | 879,562 | 32.1 | 18.1 | 14.0 | −0.3 | 4.15 | ||
| 1909 | 63,857,000 | 1,978,278 | 1,094,217 | 884,061 | 31.0 | 17.2 | 13.9 | 1.9 | 4.01 | ||
| 1910 | 64,568,000 | 1,924,778 | 1,045,665 | 879,113 | 29.8 | 16.2 | 13.6 | −2.5 | 3.85 | ||
| 1911 | 65,359,000 | 1,870,729 | 1,130,784 | 739,945 | 28.6 | 17.3 | 11.3 | 1.0 | 3.69 | ||
| 1912 | 66,146,000 | 1,869,636 | 1,029,749 | 839,887 | 28.3 | 15.6 | 12.7 | −0.7 | 3.64 | ||
| 1913 | 66,978,000 | 1,838,750 | 1,004,950 | 833,800 | 27.5 | 15.0 | 12.4 | 0.2 | 3.53 | ||
| 1914 | 67,790,000 | 1,818,596 | 1,291,310 | 527,286 | 26.8 | 19.0 | 7.8 | 4.3 | 3.44 | ||
| 1915 | 67,883,000 | 1,382,546 | 1,450,420 | −67,874 | 20.4 | 21.4 | −1.0 | 2.4 | 2.58 | ||
| 1916 | 67,715,000 | 1,029,484 | 1,298,054 | −268,570 | 15.2 | 19.2 | −4.1 | 1.6 | 1.90 | ||
| 1917 | 67,368,000 | 912,109 | 1,345,424 | −433,315 | 13.9 | 20.6 | −6.4 | 1.3 | 1.66 | ||
| 1918 | 66,811,000 | 926,813 | 1,606,475 | −679,662 | 14.3 | 24.8 | −10.2 | 1.9 | 1.67 | ||
| 1919 | 62,897,000 | 1,260,500 | 978,380 | 282,120 | 20.0 | 15.6 | 4.5 | ?63.1 | 2.37 | ||
| 1920 | 61,794,000 | 1,599,287 | 932,929 | 666,358 | 25.9 | 15.1 | 10.8 | −28.3 | 3.06 | ||
| 1921 | 62,473,000 | 1,581,130 | 869,555 | 711,575 | 25.3 | 13.9 | 11.4 | −0.4 | 2.98 | ||
| 1922 | 61,890,000 | 1,424,804 | 890,181 | 534,623 | 23.0 | 14.4 | 8.6 | −17.9 | 2.69 | ||
| 1923 | 62,250,000 | 1,318,489 | 866,754 | 451,735 | 21.2 | 13.9 | 7.2 | −1.4 | 2.45 | ||
| 1924 | 62,740,000 | 1,290,763 | 766,957 | 523,806 | 20.6 | 12.2 | 8.3 | −0.4 | 2.37 | ||
| 1925 | 63,110,000 | 1,311,259 | 753,017 | 558,242 | 20.8 | 11.9 | 8.8 | −2.9 | 2.38 | ||
| 1926 | 63,510,000 | 1,245,471 | 742,955 | 502,516 | 19.6 | 11.7 | 7.9 | −1.6 | 2.23 | ||
| 1927 | 63,940,000 | 1,178,892 | 765,331 | 413,561 | 18.4 | 12.0 | 6.5 | 0.3 | 2.09 | ||
| 1928 | 64,470,000 | 1,199,998 | 747,444 | 452,554 | 18.6 | 11.6 | 7.0 | 1.3 | 2.11 | ||
| 1929 | 64,670,000 | 1,164,062 | 814,545 | 349,517 | 18.0 | 12.6 | 5.4 | −2.3 | 2.02 | ||
| 1930 | 65,130,000 | 1,144,151 | 718,807 | 425,344 | 17.6 | 11.0 | 6.5 | 0.6 | 1.98 | ||
| 1931 | 65,510,000 | 1,047,775 | 734,165 | 313,610 | 16.0 | 11.2 | 4.8 | 1.0 | 1.80 | ||
| 1932 | 65,716,000 | 993,126 | 707,642 | 285,484 | 15.1 | 10.8 | 4.3 | −1.2 | 1.70 | ||
| 1933 | 66,027,000 | 971,174 | 737,877 | 233,297 | 14.7 | 11.2 | 3.5 | 1.2 | 1.67 | ||
| 1934 | 66,409,000 | 1,198,350 | 725,000 | 473,000 | 18.0 | 10.9 | 7.1 | −1.3 | 2.07 | ||
| 1935 | 66,871,000 | 1,263,976 | 792,018 | 471,958 | 18.9 | 11.8 | 7.1 | −0.1 | 2.20 | ||
| 1936 | 67,349,000 | 1,278,583 | 795,793 | 482,790 | 19.0 | 11.8 | 7.2 | −0.1 | 2.25 | ||
| 1937 | 67,831,000 | 1,277,046 | 794,367 | 482,679 | 18.8 | 11.7 | 7.1 | 0.1 | 2.28 | ||
| 1938 | 68,424,000 | 1,348,534 | 799,220 | 549,314 | 19.7 | 11.7 | 8.0 | 0.7 | 2.45 | ||
| 1939 | 69,314,000 | 1,413,230 | 873,348 | 539,882 | 20.4 | 12.6 | 7.8 | 5.2 | 2.59 | ||
| 1940 | 69,838,000 | 1,402,258 | 968,591 | 433,667 | 20.1 | 13.9 | 6.2 | 1.3 | 2.59 | ||
| 1941 | 70,244,000 | 1,308,232 | 1,201,435 | 106,797 | 18.6 | 17.1 | 1.5 | 4.3 | 2.43 | ||
| 1942 | 70,834,000 | 1,055,915 | 1,419,861 | -363,946 | 14.9 | 20.0 | -5.1 | 13.5 | 1.97 | ||
| 1943 | 70,411,000 | 1,124,718 | 1,665,246 | -540,528 | 16.0 | 23.7 | -7.7 | 1.7 | 2.10 | ||
| 1944 | 69,000,000 | 1,090,000(e) | 2,717,000 | -1,627,000 | 15.8 | 39.4 | -23.6 | 3.6 | 2.05 | ||
| 1945 | 66,000,000 | 820,000(e) | 2,750,000 | −1,930,000 | 12.4 | 41.7 | −29.2 | −14.3 | 1.56 | ||
| 1946 | 64,260,000 | 921,998 | 1,077,331 | −155,333 | 14.3 | 16.8 | −2.4 | −21.9 | 1.80 | 1.91 | 1.47 |
| 1947 | 65,842,000 | 1,028,421 | 965,628 | 62,793 | 15.6 | 14.7 | 1.0 | 23.7 | 1.99 | 2.02 | 1.92 |
| 1948 | 67,365,000 | 1,049,074 | 817,839 | 231,235 | 15.6 | 12.1 | 3.4 | 19.7 | 2.03 | 2.08 | 1.89 |
| 1949 | 68,080,000 | 1,106,803 | 779,852 | 326,951 | 16.3 | 11.5 | 4.8 | 5.8 | 2.14 | 2.15 | 2.13 |
| 1950 | 68,374,000 | 1,116,701 | 754,329 | 362,372 | 16.3 | 11.0 | 5.3 | −1.0 | 2.17 | 2.10 | 2.37 |
| 1951 | 68,882,000 | 1,106,380 | 755,697 | 350,683 | 16.1 | 11.0 | 5.1 | 2.3 | 2.16 | 2.07 | 2.43 |
| 1952 | 69,171,000 | 1,105,084 | 769,639 | 335,445 | 16.0 | 11.1 | 4.9 | −0.7 | 2.16 | 2.08 | 2.40 |
| 1953 | 69,564,000 | 1,095,029 | 791,654 | 303,375 | 15.7 | 11.4 | 4.4 | 1.3 | 2.13 | 2.05 | 2.37 |
| 1954 | 69,934,000 | 1,109,743 | 776,291 | 333,452 | 15.9 | 11.1 | 4.8 | 0.5 | 2.16 | 2.10 | 2.35 |
| 1955 | 70,307,000 | 1,113,408 | 795,938 | 317,470 | 15.8 | 11.3 | 4.5 | 0.8 | 2.17 | 2.11 | 2.35 |
| 1956 | 70,711,000 | 1,137,169 | 812,111 | 325,058 | 16.1 | 11.5 | 4.6 | 1.1 | 2.22 | 2.20 | 2.26 |
| 1957 | 71,166,000 | 1,165,555 | 840,195 | 325,360 | 16.4 | 11.8 | 4.6 | 1.8 | 2.28 | 2.30 | 2.21 |
| 1958 | 71,637,000 | 1,175,870 | 818,418 | 357,452 | 16.4 | 11.4 | 5.0 | 1.6 | 2.29 | 2.29 | 2.22 |
| 1959 | 72,180,000 | 1,243,922 | 835,402 | 408,520 | 17.2 | 11.6 | 5.7 | 1.9 | 2.36 | 2.37 | 2.35 |
| 1960 | 72,664,000 | 1,261,614 | 876,721 | 384,893 | 17.4 | 12.1 | 5.3 | 1.4 | 2.36 | 2.37 | 2.33 |
| 1961 | 73,352,000 | 1,313,505 | 850,300 | 463,205 | 17.9 | 11.6 | 6.3 | 3.2 | 2.44 | 2.46 | 2.40 |
| 1962 | 74,049,000 | 1,316,534 | 878,814 | 437,720 | 17.8 | 11.9 | 5.9 | 3.6 | 2.44 | 2.44 | 2.42 |
| 1963 | 75,019,000 | 1,355,595 | 895,070 | 460,525 | 18.1 | 11.9 | 6.1 | 7.0 | 2.51 | 2.52 | 2.47 |
| 1964 | 75,273,000 | 1,357,304 | 870,319 | 486,985 | 18.0 | 11.6 | 6.5 | −3.1 | 2.54 | 2.54 | 2.48 |
| 1965 | 76,061,000 | 1,325,386 | 907,882 | 417,504 | 17.4 | 11.9 | 5.5 | 5.0 | 2.50 | 2.51 | 2.48 |
| 1966 | 76,734,000 | 1,318,303 | 911,984 | 406,319 | 17.2 | 11.9 | 5.3 | 3.5 | 2.51 | 2.54 | 2.42 |
| 1967 | 76,954,000 | 1,272,276 | 914,417 | 357,859 | 16.5 | 11.9 | 4.7 | −1.8 | 2.46 | 2.49 | 2.34 |
| 1968 | 77,249,000 | 1,214,968 | 976,521 | 238,447 | 15.7 | 12.6 | 3.1 | 0.7 | 2.36 | 2.38 | 2.30 |
| 1969 | 77,918,000 | 1,142,366 | 988,092 | 154,274 | 14.7 | 12.7 | 2.0 | 6.7 | 2.22 | 2.21 | 2.24 |
| 1970 | 77,772,000 | 1,047,737 | 975,664 | 72,073 | 13.5 | 12.5 | 0.9 | −2.8 | 2.05 | 2.02 | 2.19 |
| 1971 | 78,355,000 | 1,013,396 | 965,623 | 47,773 | 12.9 | 12.3 | 0.6 | 6.9 | 1.97 | 1.92 | 2.13 |
| 1972 | 78,717,000 | 901,657 | 965,689 | −64,032 | 11.5 | 12.3 | −0.8 | 5.4 | 1.73 | 1.71 | 1.79 |
| 1973 | 78,951,000 | 815,969 | 962,988 | −147,019 | 10.3 | 12.2 | −1.9 | 4.9 | 1.56 | 1.54 | 1.58 |
| 1974 | 78,966,000 | 805,500 | 956,573 | −151,073 | 10.2 | 12.1 | −1.9 | 2.1 | 1.53 | 1.51 | 1.54 |
| 1975 | 78,862,000 | 782,310 | 989,649 | −207,339 | 9.9 | 12.5 | −2.6 | 1.3 | 1.48 | 1.45 | 1.54 |
| 1976 | 78,299,000 | 798,334 | 966,873 | −168,539 | 10.2 | 12.3 | −2.2 | −4.9 | 1.50 | 1.46 | 1.64 |
| 1977 | 78,161,000 | 805,496 | 931,155 | −125,659 | 10.3 | 11.9 | −1.6 | −0.2 | 1.51 | 1.41 | 1.85 |
| 1978 | 78,066,000 | 808,619 | 955,550 | −146,931 | 10.4 | 12.2 | −1.9 | 0.7 | 1.50 | 1.38 | 1.90 |
| 1979 | 78,082,000 | 817,217 | 944,474 | −127,257 | 10.5 | 12.1 | −1.6 | 1.8 | 1.50 | 1.38 | 1.90 |
| 1980 | 78,295,000 | 865,789 | 952,371 | −86,582 | 11.1 | 12.2 | −1.1 | 3.8 | 1.56 | 1.45 | 1.94 |
| 1981 | 78,399,000 | 862,100 | 954,436 | −92,336 | 11.0 | 12.2 | −1.2 | 2.5 | 1.53 | 1.44 | 1.85 |
| 1982 | 78,293,000 | 861,275 | 943,832 | −82,557 | 11.0 | 12.1 | −1.1 | −0.3 | 1.51 | 1.41 | 1.86 |
| 1983 | 78,082,000 | 827,933 | 941,032 | −113,099 | 10.6 | 12.1 | −1.4 | −1.3 | 1.43 | 1.33 | 1.79 |
| 1984 | 77,797,000 | 812,292 | 917,299 | −105,007 | 10.4 | 11.8 | −1.3 | −2.4 | 1.38 | 1.29 | 1.74 |
| 1985 | 77,619,000 | 813,803 | 929,649 | −115,846 | 10.5 | 12.0 | −1.5 | −0.8 | 1.37 | 1.28 | 1.73 |
| 1986 | 77,635,000 | 848,232 | 925,426 | −77,194 | 10.9 | 11.9 | −1.0 | 1.2 | 1.41 | 1.35 | 1.70 |
| 1987 | 77,718,000 | 867,969 | 901,291 | −33,322 | 11.2 | 11.6 | −0.4 | 1.5 | 1.44 | 1.37 | 1.74 |
| 1988 | 78,116,000 | 892,993 | 900,627 | −7,634 | 11.4 | 11.5 | −0.1 | 5.2 | 1.46 | 1.41 | 1.67 |
| 1989 | 78,677,000 | 880,459 | 903,441 | −22,982 | 11.2 | 11.5 | −0.3 | 7.5 | 1.42 | 1.40 | 1.57 |
| 1990 | 79,753,227 | 905,675 | 921,445 | −15,770 | 11.4 | 11.6 | −0.2 | 13.9 | 1.45 | 1.45 | 1.52 |
| 1991 | 80,274,564 | 830,019 | 911,245 | −81,226 | 10.4 | 11.4 | −1.0 | 7.5 | 1.33 | 1.42 | 0.98 |
| 1992 | 80,974,632 | 809,114 | 885,443 | −76,329 | 10.1 | 11.0 | −1.0 | 9.7 | 1.29 | 1.40 | 0.83 |
| 1993 | 81,338,093 | 798,447 | 897,270 | −98,823 | 9.9 | 11.1 | −1.2 | 5.7 | 1.28 | 1.39 | 0.78 |
| 1994 | 81,538,603 | 769,603 | 884,661 | −115,058 | 9.5 | 10.9 | −1.4 | 3.9 | 1.24 | 1.35 | 0.77 |
| 1995 | 81,817,499 | 765,221 | 884,588 | −119,367 | 9.4 | 10.8 | −1.5 | 4.9 | 1.25 | 1.34 | 0.84 |
| 1996 | 82,012,162 | 796,013 | 882,843 | −86,830 | 9.7 | 10.8 | −1.1 | 3.5 | 1.32 | 1.40 | 0.95 |
| 1997 | 82,057,379 | 812,173 | 860,389 | −48,216 | 9.9 | 10.5 | −0.6 | 1.2 | 1.37 | 1.44 | 1.04 |
| 1998 | 82,037,011 | 785,034 | 852,382 | −67,348 | 9.6 | 10.4 | −0.8 | 0.6 | 1.36 | 1.41 | 1.09 |
| 1999 | 82,163,475 | 770,744 | 846,330 | −75,586 | 9.4 | 10.3 | −0.9 | 2.4 | 1.36 | 1.41 | 1.15 |
| 2000 | 82,259,540 | 766,999 | 838,797 | −71,798 | 9.3 | 10.2 | −0.9 | 2.1 | 1.38 | 1.41 | 1.21 |
| 2001 | 82,440,309 | 734,475 | 828,541 | −94,066 | 8.9 | 10.1 | −1.1 | 3.3 | 1.35 | 1.38 | 1.23 |
| 2002 | 82,536,680 | 719,250 | 841,686 | −122,436 | 8.7 | 10.2 | −1.5 | 2.7 | 1.34 | 1.37 | 1.24 |
| 2003 | 82,531,671 | 706,721 | 853,946 | −147,225 | 8.6 | 10.3 | −1.8 | 1.7 | 1.34 | 1.36 | 1.26 |
| 2004 | 82,500,849 | 705,622 | 818,271 | −112,649 | 8.5 | 9.9 | −1.4 | 1.0 | 1.36 | 1.37 | 1.31 |
| 2005 | 82,437,995 | 685,795 | 830,227 | −144,432 | 8.3 | 10.1 | −1.8 | 1.0 | 1.34 | 1.36 | 1.30 |
| 2006 | 82,314,906 | 672,724 | 821,627 | −148,903 | 8.2 | 10.0 | −1.8 | 0.3 | 1.33 | 1.34 | 1.30 |
| 2007 | 82,217,837 | 684,862 | 827,155 | −142,293 | 8.3 | 10.0 | −1.7 | 0.5 | 1.37 | 1.38 | 1.37 |
| 2008 | 82,002,356 | 682,514 | 844,439 | −161,925 | 8.3 | 10.3 | −2.0 | −3.1 | 1.38 | 1.37 | 1.40 |
| 2009 | 81,802,257 | 665,126 | 854,544 | −189,418 | 8.1 | 10.4 | −2.3 | 2.3 | 1.36 | 1.35 | 1.40 |
| 2010 | 81,751,602 | 677,947 | 858,768 | −180,821 | 8.3 | 10.5 | −2.2 | 1.6 | 1.39 | 1.39 | 1.46 |
| 2011 | 80,233,100 | 662,685 | 852,328 | −189,643 | 8.3 | 10.4 | −2.3 | −16.3 | 1.39 | 1.38 | 1.46 |
| 2012 | 80,399,300 | 673,544 | 869,582 | −196,038 | 8.4 | 10.8 | −2.4 | 4.5 | 1.41 | 1.40 | 1.48 |
| 2013 | 80,585,700 | 682,069 | 893,825 | −211,756 | 8.5 | 11.1 | −2.6 | 5.0 | 1.42 | 1.41 | 1.49 |
| 2014 | 80,925,000 | 714,927 | 868,356 | −153,429 | 8.9 | 10.8 | −1.9 | 6.1 | 1.47 | 1.47 | 1.54 |
| 2015 | 81,459,000 | 737,575 | 925,200 | −187,625 | 9.1 | 11.4 | −2.3 | 8.9 | 1.50 | 1.50 | 1.56 |
| 2016 | 82,349,400 | 792,141 | 910,902 | −118,761 | 9.6 | 11.1 | −1.4 | 12.4 | 1.59 | 1.60 | 1.64 |
| 2017 | 82,665,600 | 784,901 | 932,272 | −147,371 | 9.5 | 11.3 | −1.8 | 5.6 | 1.57 | 1.58 | 1.61 |
| 2018 | 82,887,000 | 787,523 | 954,874 | −167,351 | 9.5 | 11.5 | −2.0 | 4.7 | 1.57 | 1.58 | 1.60 |
| 2019 | 83,019,200 | 778,090 | 939,520 | −161,430 | 9.4 | 11.3 | −1.9 | 4.2 | 1.54 | 1.56 | 1.56 |
| 2020 | 83,155,031 | 773,144 | 985,572 | −212,428 | 9.3 | 11.8 | −2.6 | 3.2 | 1.53 | 1.55 | 1.54 |
| 2021 | 83,237,124 | 795,492 | 1,023,687 | −228,195 | 9.6 | 12.3 | −2.7 | 2.8 | 1.58 | 1.60 | 1.54 |
| 2022 | 83,118,501 | 738,819 | 1,066,341 | −327,522 | 8.9 | 12.8 | −3.9 | 15.4 | 1.49 | 1.51 | 1.46 |
| 2023 | 83,456,045 | 692,989 | 1,028,206 | −335,217 | 8.3 | 12.3 | −4.0 | 8.8 | 1.45 | 1.48 | 1.40 |
| 2024 | 83,577,140 | 677,117 | 1,007,758 | −330,641 | 8.1 | 12.1 | −4.0 | 5.6 | 1.42 | 1.45 | 1.33 |
| 2025 | 83,497,147(e) | 654,267 | 1,006,346 | -352,079 | 7.8 | 12.1 | -4.3 | 1.31 | 1.37 | 1.24 | |
| Period | Live births | Deaths | Natural increase |
|---|---|---|---|
| January 2025 | 48,400 | 97,794 | −49,394 |
| January 2026 | 49,228 | 100,241 | −51,013 |
| Difference | |||
| Source: | |||
| State | TFR |
|---|---|
| 1.42 | |
| 1.40 | |
| 1.39 | |
| 1.39 | |
| 1.38 | |
| 1.37 | |
| 1.35 | |
| 1.34 | |
| 1.34 | |
| 1.32 | |
| 1.31 | |
| 1.31 | |
| 1.30 | |
| 1.24 | |
| 1.23 | |
| 1.22 | |
| 1.21 |
| Regierungsbezirk or city | TFR |
|---|---|
| Stuttgart | 1.44 |
| Karlsruhe | 1.34 |
| Freiburg | 1.40 |
| Tübingen | 1.47 |
| 1.38 | |
| 1.47 | |
| 1.46 | |
| 1.39 | |
| 1.39 | |
| 1.44 | |
| 1.54 | |
| 1.39 | |
| 1.35 | |
| Kassel | 1.46 |
| 1.38 | |
| 1.42 | |
| 1.53 | |
| Weser-Ems | 1.50 |
| Düsseldorf | 1.41 |
| Cologne | 1.34 |
| Münster | 1.50 |
| Detmold | 1.50 |
| Arnsberg | 1.45 |
| 1.47 | |
| 1.38 | |
| Rheinhessen-Pfalz | 1.45 |
| 1.28 | |
| 1.14 | |
| 1.38 |
| Nationality/region | TFR |
|---|---|
| Germany total | 1.35 |
| German nationality | 1.23 |
| Foreign nationality | 1.84 |
| Former West Germany + Berlin | 1.38 |
| Former East Germany | 1.27 |
| Age group | Male | Female | Total | Percent |
|---|---|---|---|---|
| Total | 39,145,941 | 41,073,754 | 80,219,695 | 100 |
| 0–4 | 1,714,872 | 1,624,023 | 3,338,895 | 4.16 |
| 5–9 | 1,809,024 | 1,716,806 | 3,525,830 | 4.40 |
| 10–14 | 2,021,305 | 1,919,261 | 3,940,566 | 4.91 |
| 15–19 | 2,057,155 | 1,956,725 | 4,013,880 | 5.00 |
| 20–24 | 2,463,932 | 2,371,707 | 4,835,639 | 6.03 |
| 25–29 | 2,455,885 | 2,416,648 | 4,872,533 | 6.07 |
| 30–34 | 2,385,305 | 2,366,606 | 4,751,911 | 5.92 |
| 35–39 | 2,378,055 | 2,364,838 | 4,742,893 | 5.91 |
| 40–44 | 3,209,481 | 3,141,708 | 6,351,189 | 7.92 |
| 45–49 | 3,547,254 | 3,452,425 | 6,999,679 | 8.73 |
| 50–54 | 3,113,463 | 3,092,831 | 6,206,294 | 7.74 |
| 55–59 | 2,668,976 | 2,750,474 | 5,419,450 | 6.76 |
| 60–64 | 2,298,903 | 2,403,912 | 4,702,815 | 5.86 |
| 65–69 | 1,999,287 | 2,174,064 | 4,173,351 | 5.20 |
| 70–74 | 2,247,196 | 2,614,043 | 4,861,239 | 6.06 |
| 75–79 | 1,413,881 | 1,856,402 | 3,270,283 | 4.08 |
| 80–84 | 878,797 | 1,449,286 | 2,328,083 | 2.90 |
| 85–89 | 369,029 | 966,047 | 1,335,076 | 1.66 |
| 90–94 | 95,074 | 335,526 | 430,600 | 0.54 |
| 95–99 | 17,388 | 88,656 | 106,044 | 0.13 |
| 100+ | 1,679 | 11,766 | 13,445 | 0.02 |
| Age group | Male | Female | Total | Percent |
| 0–14 | 5,545,201 | 5,260,090 | 10,805,291 | 13.47 |
| 15–64 | 26,578,409 | 26,317,874 | 52,896,283 | 65.94 |
| 65+ | 7,022,331 | 9,495,790 | 16,518,121 | 20.59 |
| Age group | Male | Female | Total | Percent |
|---|---|---|---|---|
| Total | 41,026,519 | 42,128,512 | 83,155,031 | 100 |
| 0–4 | 2,036,084 | 1,933,054 | 3,969,138 | 4.77 |
| 5–9 | 1,944,171 | 1,839,397 | 3,783,568 | 4.55 |
| 10–14 | 1,916,110 | 1,808,984 | 3,725,094 | 4.48 |
| 15–19 | 1,991,487 | 1,865,287 | 3,856,774 | 4.64 |
| 20–24 | 2,394,221 | 2,176,270 | 4,570,491 | 5.50 |
| 25–29 | 2,552,806 | 2,360,133 | 4,912,939 | 5.91 |
| 30–34 | 2,876,938 | 2,704,150 | 5,581,088 | 6.71 |
| 35–39 | 2,688,873 | 2,602,003 | 5,290,876 | 6.36 |
| 40–44 | 2,531,208 | 2,503,680 | 5,034,888 | 6.05 |
| 45–49 | 2,526,278 | 2,509,582 | 5,035,860 | 6.06 |
| 50–54 | 3,265,131 | 3,222,093 | 6,487,224 | 7.80 |
| 55–59 | 3,414,124 | 3,403,194 | 6,817,318 | 8.20 |
| 60–64 | 2,866,561 | 2,951,576 | 5,818,137 | 7.00 |
| 65–69 | 2,333,788 | 2,565,316 | 4,899,104 | 5.89 |
| 70–74 | 1,854,514 | 2,113,556 | 3,968,070 | 4.77 |
| 75–79 | 1,551,030 | 1,916,998 | 3,468,028 | 4.17 |
| 80–84 | 1,432,318 | 1,998,184 | 3,430,502 | 4.13 |
| 85–89 | 615,608 | 1,046,633 | 1,662,241 | 2.00 |
| 90–94 | 200,432 | 471,151 | 671,583 | 0.81 |
| 95–99 | 30,826 | 120,817 | 151,643 | 0.18 |
| 100–104 | 3,122 | 13,587 | 16,709 | 0.02 |
| 105–109 | 703 | 2,417 | 3,120 | |
| 110+ | 186 | 450 | 636 | |
| Age group | Male | Female | Total | Percent |
| 0–14 | 5,896,365 | 5,581,435 | 11,477,800 | 13.80 |
| 15–64 | 27,107,627 | 26,297,968 | 53,405,595 | 64.22 |
| 65+ | 8,022,527 | 10,249,109 | 18,271,636 | 21.97 |
Social issues
Most babies born in Germany are born to parents who are married. In 2019, out of about 778,000 babies born, around 258,000 were born to parents who were not married. This means that about one-third of all babies in Germany were born to parents who were not married. This number has been growing over time but has started to stay the same or even go down in recent years.
Studies show that the number of children a woman has can depend on how much education she has. In Western Germany, women with the most education were less likely to have children. In Eastern Germany, things were different because of past government policies that encouraged educated women to have children. These policies changed after a major event in history, and now educated women in Eastern Germany sometimes have more children than others.
| Number of children | Compulsory education | Intermediary education | Highest education |
|---|---|---|---|
| One child | 22 | 30 | 31 |
| Two children | 39 | 48 | 48 |
| Three or more children | 39 | 22 | 21 |
| Number of children | Compulsory education | Intermediary education | Highest education |
|---|---|---|---|
| One child | 23 | 33 | 33 |
| Two children | 37 | 46 | 51 |
| Three or more children | 40 | 21 | 16 |
Ethnic minorities and migrant background (Migrationshintergrund)
Germany collects data on people's family backgrounds rather than their ethnic identities. This helps understand the country's diverse population. In 2019, 40% of children under five had at least one parent born outside of Germany. Most families with parents from other countries live in western Germany.
The largest groups come from Turkey, Poland, and Russia. There are also smaller groups, such as Danes, Frisians, Sorbs, and Roma, who have lived in certain areas for centuries. After World War II, many ethnic Germans moved to western Germany from eastern regions. Since the 1960s, people from many countries, including the former Soviet Union, have come to live in Germany. Today, Germany is home to people from all over the world, making it a diverse nation.
Main article: Migration background
| Background group | Year | |||||||||
|---|---|---|---|---|---|---|---|---|---|---|
| 2005 | 2011 | 2016 | 2022 | 2023 | ||||||
| Number | % | Number | % | Number | % | Number | % | Number | % | |
| European | ||||||||||
| Overall | 72,625,000 | 89.2% | 71,111,000 | 85.5% | 71,407,000 | 85.1% | ||||
| Without migrant background | 66,413,000 | 81.3% | 64,551,000 | 81.4% | 62,989,000 | 77.4% | 59,278,000 | 71.3% | 58,968,000 | 70.3% |
| | 1,046,000 | 1,424,000 | 1,868,000 | 2,3% | 2,201,000 | 2.6% | 2,199,000 | 2.6% | ||
| | 406,000 | 472,000 | 788,000 | 1% | 1,096,000 | 1.3% | 1,146,000 | 1.4% | ||
| | 794,000 | 701,000 | 861,000 | 1,1% | 905,000 | 1.1% | 876,000 | 1.0% | ||
| | 386,000 | 349,000 | 443,000 | 0,5% | 434,000 | 0.5% | 432,000 | 0.5% | ||
| | 410,000 | 325,000 | 441,000 | 0,5% | 419,000 | 0.5% | 400,000 | 0.5% | ||
| | 309,000 | 254,000 | 280,000 | 0,3% | 353,000 | 0.4% | 341,000 | 0.4% | ||
| | 49,000 | 77,000 | 238,000 | 0,3% | 340,000 | 0.4% | 376,000 | 0.4% | ||
| | 173,000 | 142,000 | 209,000 | 0,3% | 233,000 | 0.3% | 233,000 | 0.3% | ||
| | 190,000 | 203,000 | 206,000 | 0,3% | 233,000 | 0.3% | 218,000 | 0.3% | ||
| | 157,000 | 153,000 | 168,000 | 0,2% | 228,000 | 0.3% | 222,000 | 0.3% | ||
| Other EU member states (primarily Hungarian, Czech, and Portuguese) | 824,000 | 1% | 1,129,000 | 1.4% | 1,122,000 | 1.3% | ||||
| Overall | 69,315,000 | 85.1% | 66,849,000 | 80.4% | 66,533,000 | 79.3% | ||||
| European Other | ||||||||||
| | 1,290,000 | 1,189,000 | 1,223,000 | 1,5% | 1,354,000 | 1.6% | 1,353,000 | 1.6% | ||
| | – | 246,000 | 272,000 | 0,3% | 583,000 | 0.7% | 1,034,000 | 1.2% | ||
| | – | 270,000 | 356,000 | 0,4% | 542,000 | 0.7% | 594,000 | 0.7% | ||
| | 329,000 | 202,000 | 248,000 | 0,3% | 538,000 | 0.6% | 556,000 | 0.7% | ||
| | 263,065 | 252,000 | 288,000 | 0,4% | 382,000 | 0.5% | 387,000 | 0.5% | ||
| Others (primarily Macedonian, Swiss and British) | 923,000 | 1.1% | 863,000 | 1% | 950,000 | 1.1% | ||||
| Overall | 3,310,000 | 4.1% | 4,262,000 | 5.1% | 4,874,000 | 5.8% | ||||
| Asians | ||||||||||
| | 2,766,000 | 2,643,000 | 2,797,000 | 3,4% | 2,835,000 | 3.4% | 2,926,000 | 3.5% | ||
| | – | 917,000 | 969,000 | 1,2% | 1,325,000 | 1.6% | 1,311,000 | 1.6% | ||
| | – | 53,000 | 521,000 | 0,6% | 1,225,000 | 1.5% | 1,281,000 | 1.5% | ||
| | 88,000 | 131,000 | 231,000 | 0,3% | 435,000 | 0.5% | 476,000 | 0.6% | ||
| | 113,000 | 106,000 | 206,000 | 0,3% | 393,000 | 0.5% | 399,000 | 0.5% | ||
| | 150,000 | 130,000 | 164,000 | 0,2% | 304,000 | 0.4% | 336,000 | 0.4% | ||
| | 80,000 | 93,000 | 157,000 | 0,2% | 217,000 | 0.3% | 217,000 | 0.3% | ||
| | 150,000 | 146,000 | 167,000 | 0,2% | 236,000 | 0.2% | 215,000 | 0.2% | ||
| Others | 1,006,000 | 1,2% | 1,554,000 | 1.9% | 1,662,000 | 2.0% | ||||
| Overall | 6,218,000 | 7,6% | 8,495,000 | 10.3% | 8,842,000 | 10.5% | ||||
| African | ||||||||||
| Sub-Saharan African | 222,000 | 246,000 | 395,000 | 0,5% | 660,000 | 0.8% | 711,000 | 0.8% | ||
| | 147,000 | 141,000 | 191,000 | 0,2% | 257,000 | 0.3% | 278,000 | 0.3% | ||
| Other Maghreb countries: | 108,000 | 121,000 | 158,000 | 0,2% | 242,000 | 0.3% | 281,000 | 0.3% | ||
| Overall | 477,000 | 508,000 | 744,000 | 0.9% | 1,159,000 | 1.4% | 1,270,000 | 1.5% | ||
| Americas | ||||||||||
| | 140,000 | 123,000 | 154,000 | 0,2% | 216,000 | 0.3% | 215,000 | 0.3% | ||
| Other peoples from the Americas | 191,000 | 201,000 | 267,000 | 0,3% | 466,000 | 0.5% | 499,000 | 0.6% | ||
| Overall | 331,000 | 324,000 | 421,000 | 0,5% | 682,000 | 0.8% | 714,000 | 0.8% | ||
| Australia/Oceania | ||||||||||
| Overall | – | 40,000 | 0,05% | 26,000 | 0.03% | 29,000 | 0.03% | |||
| Other/unspecified/mixed | ||||||||||
| Overall | 2,536,000 | 1,310,000 | 1,381,000 | 1,7% | 1,628,000 | 1.9% | 1,613,000 | 1.9% | ||
| Total: Foreign background | ||||||||||
| Overall | 15,227,000 | 14,796,000 | 18,443,000 | 22,6% | 23,825,000 | 28.7% | 24,907,000 | 29.7% | ||
| Total | 81,640,000 | 79,347,000 | 81,432,000 | 100% | 83,103,000 | 100% | 83,875,000 | 100% | ||
Foreign nationals in Germany
At the end of 2023, Germany was home to many people from other countries. The most common groups of foreign residents included people from Turkey, Poland, and Syria. This list focuses only on foreign nationals who lived in Germany and does not include everyone with German citizenship or those who were only visiting.
| Rank | Nationality | Population (corrected based on Census 2022) | Change 2023 to 2024 | ||
|---|---|---|---|---|---|
| 31 December 2022 | 31 December 2023 | 31 December 2024 | |||
| Total | 11,495,135 | 12,108,988 | 12,392,275 | 283,287 | |
| 1 | 1,323,571 | 1,391,800 | 1,402,783 | 10,983 | |
| 2 | 863,335 | 974,322 | 1,085,298 | 110,976 | |
| 3 | 829,143 | 879,823 | 889,482 | 9,659 | |
| 4 | 753,056 | 776,424 | 771,276 | −5,148 | |
| 5 | 732,191 | 741,784 | 723,151 | −18,633 | |
| 6 | 573,632 | 571,379 | 564,547 | −6,832 | |
| 7 | 330,834 | 377,986 | 404,269 | 26,283 | |
| 8 | 399,547 | 395,562 | 384,451 | −11,111 | |
| 9 | 366,026 | 371,128 | 362,421 | −8,707 | |
| 10 | 276,231 | 294,906 | 309,435 | 14,529 | |
| 11 | 305,821 | 303,375 | 298,398 | −4,977 | |
| 12 | 257,565 | 272,362 | 266,385 | −5,977 | |
| 13 | 187,325 | 224,566 | 264,832 | 40,266 | |
| 14 | 239,580 | 249,590 | 252,808 | 3,218 | |
| 15 | 239,740 | 239,278 | 229,916 | −9,362 | |
| 16 | 209,845 | 222,235 | 227,689 | 5,454 | |
| 17 | 181,007 | 187,162 | 184,836 | −2,326 | |
| 18 | 167,407 | 172,456 | 175,638 | 3,182 | |
| 19 | 166,518 | 165,518 | 163,916 | −1,602 | |
| 20 | 130,993 | 139,818 | 149,736 | 9,918 | |
| 21 | 131,987 | 143,680 | 147,714 | 4,034 | |
| 22 | 122,327 | 135,564 | 144,336 | 8,772 | |
| 23 | 133,321 | 133,248 | 132,606 | −642 | |
| 24 | 120,814 | 121,149 | 120,205 | −944 | |
| 25 | 97,486 | 107,677 | 120,045 | 12,368 | |
| 26 | 117,966 | 119,065 | 119,654 | 589 | |
| 27 | 93,382 | 109,108 | 118,697 | 9,589 | |
| 28 | 105,233 | 108,621 | 110,391 | 1,770 | |
| 29 | 79,423 | 86,960 | 92,814 | 5,854 | |
| 30 | 72,786 | 82,019 | 88,594 | 6,575 | |
Population density and distribution
Germany is the second-most populous country in Europe after Russia, and ranks as the 19th largest country in the world in terms of population. With an estimated 83.2 million people, it has a population density of 233 inhabitants per square kilometer.
Germany is made up of sixteen states, called Länder. These states vary in size and population. Some are city-states, while others cover larger areas. For easier management, four of these states are divided into 19 Government Districts. At the local level, Germany is split into 400 districts, including both rural and urban areas.
Main articles: List of cities in Germany; List of cities in Germany with more than 100,000 inhabitants; and Metropolitan regions in Germany
| State | Capital | Area (km2) | Population (31 Dec 2022) | Foreigners | Population density (per km2) |
|---|---|---|---|---|---|
| North Rhine-Westphalia | Düsseldorf | 34,112 | 18,139,116 | 2,828,367 | 532 |
| Bavaria | Munich | 70,541 | 13,369,116 | 2,073,494 | 190 |
| Baden-Württemberg | Stuttgart | 35,748 | 11,280,257 | 2,012,237 | 316 |
| Lower Saxony | Hanover | 47,709 | 8,140,242 | 959,786 | 171 |
| Hesse | Wiesbaden | 21,116 | 6,391,360 | 1,199,775 | 303 |
| Rhineland-Palatinate | Mainz | 19,858 | 4,159,150 | 566,026 | 209 |
| Saxony | Dresden | 18,450 | 4,086,152 | 300,164 | 221 |
| Berlin | Berlin | 891 | 3,755,251 | 834,349 | 4,215 |
| Schleswig-Holstein | Kiel | 15,804 | 2,953,270 | 299,787 | 187 |
| Brandenburg | Potsdam | 29,654 | 2,573,135 | 179,872 | 87 |
| Saxony-Anhalt | Magdeburg | 20,454 | 2,186,643 | 160,990 | 107 |
| Thuringia | Erfurt | 16,202 | 2,126,846 | 161,291 | 131 |
| Hamburg | Hamburg | 755 | 1,892,122 | 363,283 | 2,506 |
| Mecklenburg-Vorpommern | Schwerin | 23,295 | 1,628,378 | 105,437 | 70 |
| Saarland | Saarbrücken | 2,571 | 992,666 | 139,189 | 386 |
| Bremen | Bremen | 419 | 684,864 | 144,148 | 1,634 |
| Germany | Berlin | 357,582 | 84,358,845 | 12,324,195 | 236 |
| Metropolitan region | Location | Description | Approx. population (millions) | Large minority groups |
|---|---|---|---|---|
| Rhine-Ruhr |  | The metropolitan area is part of the pan-European Blue Banana mega region and is a significant industrial and commercial hub, home to many of Germany's biggest corporations and contributing as much as 15% to the German GDP. Included in the rather polycentric conurbation are the cities of Cologne, Düsseldorf, Bonn, Dortmund and Essen served by two of the country's largest airports: Düsseldorf Airport and the Cologne Bonn Airport. Particularly among young Germans, Cologne and Düsseldorf are known for their nightlife and open-minded atmosphere. | 10 | Turks, Poles, Italians, Romanians, Africans, Arabs, Greeks, Dutch, Russians, Serbs, Bulgarians and Spaniards |
| Berlin/Brandenburg | 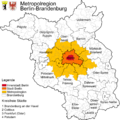 | Berlin is the capital and largest city. It lies in the eastern part of the country, completely surrounded by the rather sparsely populated state of Brandenburg. Berlin is regarded as one of Europe's most open, vibrant and ever changing capitals. The city is arguably the most diverse city in Germany regarding culture and ethnicity. Regarded as an economically weak region of Germany for a long time, it is now transforming itself into the entrepreneurial center of Europe. Dubbed the "Silicon Allee" by insiders of the tech industry, Berlin is home to countless startup companies and is one of Germany's densest knowledge hubs, with four public universities and countless research centers. | 6 | Turks, Russians, Poles, Africans, Italians, Americans, Vietnamese, Serbs, Arabs, Bulgarians, Romanians, French and Spaniards |
| Munich |  | The metropolitan area in and around Munich has one of Germany's highest standards of living. Housing some of the country's largest car and machine companies, it is known for its economic strength mixed with the uniqueness of Bavarian culture, taking up almost the entirety of southern Bavaria. It is the closest metropolitan area to the Alps. | 5.7 | Turks, Albanians, Croats, Italians, Poles, Greeks, Austrians, Romanians, Arabs, Africans and Serbs |
| Rhine-Main |  | Frankfurt is a financial and commercial center both for Germany and continental Europe. Almost all of Germany's big banks and the ECB have their headquarters located inside the city of Frankfurt. Despite its population of under 1 million, it is Germany's only city with a large, visible cluster of skyscrapers. The city is one of Europe's biggest transit hubs, with Europe's 6th busiest airport (Frankfurt airport), Germany's second-busiest railway station and one of the EU's most heavily used motorway interchanges. | 5.5 | Turks, Poles, Italians, African, Croats, Romanians, Greeks, Serbs, Spaniards, Americans, Chinese, Arabs and Indians |
| Hamburg | Hamburg is the country's second largest city and the biggest Hanseatic city in Europe. It is Europe's 3rd busiest container port with just under 9 million TEUs annually. The city is proud of its diverse nightlife and music scene centered in and around the famous St. Pauli district. | 5.3 | Turks, Albanians, Poles, African, Portuguese, Romanians, Russians, Italians and Spaniards | |
| Stuttgart | Stuttgart has a reputation for research, inventions and industry. The German headquarters of many international enterprises are in Stuttgart. This contrasts with the strong rural, down-to-earth attitude of the Stuttgarters of all classes. A popular slogan is "We are good at everything. Except speaking High (standard) German." | 5.2 | Turks, Albanians, Greeks, Dutch, Italians, Croats, Serbs, French, Chinese, Romanians, Americans and Spaniards. | |
| Hannover–Braunschweig–Göttingen–Wolfsburg |  | The relatively urban south of Lower Saxony, located on route between the Ruhr area and Berlin, and the route from Hamburg to the south, has been important for logistics, industry, but has also developed a strong standing in the service industries. | 3.7 | Turks, Kurds (especially around Celle), Serbs, Ukrainians, Greeks, Russians, Italians (especially in Wolfsburg) and Spanish (Especially in Hanover). |
| Bremen/Oldenburg | Located in the northwestern part of Germany, the main axis contains the cities of Bremen, Delmenhorst and Oldenburg, with the cities of Wilhelmshaven and Bremerhaven being the northern corners on or connected to the North Sea. Major rural areas are covered in between these cities. There is a smooth transition to the Hamburg metropolitan area to the east. | 2.7 | Turks, Russians, Albanians, Serbs, Portuguese, Iranians, Dutch, Americans and Britons. | |
| Central German Metropolitan Region | The economic region stretches across three federal states. The major city is Leipzig in Saxony; other important cities are Halle/Saale, Gera and Jena. The region is known for its universities and research, for its trade fairs and conventions, as a central distribution hub (Leipzig-Halle-Airport), as a center for chemical and industrial production, for the well preserved inner cities and for the developed classical and alternative cultural scene. Leipzig is one of the fastest-growing cities in Germany, with a rising economy. | 2.4 | Russians, Poles, Vietnamese, Italians, Romanians, Ukrainians, Chinese, Turks, Portuguese, people from Syria, from Kazakhstan and from Afghanistan. |
Immigration
Main articles: Immigration to Germany and Germans Abroad
See also: 2015 European migrant crisis
Germany is home to many people from other countries, making it one of the top places in the world for people to live who are not from that country. The largest group of people from outside Germany are from Turkey. Since the 1960s, Germany has welcomed people to help with jobs, especially from Southern and Eastern Europe and Turkey. Many of these people stayed and made Germany their home.
In 2015, many people came to Germany seeking safety because of big problems in places like Syria, Iraq, and Afghanistan. This number was very high in 2016 but then started to go down. By 2022, about 28.7% of people living in Germany, or 23.8 million, had family ties to other countries. After big events like the conflict in Ukraine in 2022, even more people from Ukraine found safety in Germany.
| Year | Total | Germans | Non-Germans | ||||||
|---|---|---|---|---|---|---|---|---|---|
| Arrivals | Departures | Net migration | Arrivals | Departures | Net migration | Arrivals | Departures | Net migration | |
| 1950 | 96,140 | 78,148 | 17,992 | – | – | – | – | – | – |
| 1951 | 88,349 | 126,071 | −37,722 | – | – | – | – | – | – |
| 1952 | 88,089 | 135,796 | −47,707 | – | – | – | – | – | – |
| 1953 | 101,599 | 122,264 | −20,665 | – | – | – | – | – | – |
| 1954 | 111,490 | 136,212 | −24,722 | 64,637 | 107,381 | −42,744 | 46,853 | 28,831 | 18,022 |
| 1955 | 127,921 | 136,977 | −9,056 | 67,553 | 101,429 | −33,876 | 60,368 | 35,548 | 24,820 |
| 1956 | 159,086 | 168,101 | −9,015 | 76,581 | 119,880 | −43,299 | 82,505 | 48,221 | 34,284 |
| 1957 | 200,142 | 173,171 | 26,971 | 92,724 | 113,879 | −21,155 | 107,418 | 59,292 | 48,126 |
| 1958 | 212,520 | 161,865 | 50,655 | 94,238 | 97,854 | −3,616 | 118,282 | 64,011 | 54,271 |
| 1959 | 227,600 | 178,864 | 48,736 | 81,681 | 98,234 | −16,553 | 145,919 | 80,630 | 65,289 |
| 1960 | 395,016 | 218,574 | 176,442 | 77,331 | 94,133 | −16,802 | 317,685 | 124,441 | 193,244 |
| 1961 | 489,423 | 266,536 | 222,887 | 78,354 | 85,012 | −6,658 | 411,069 | 181,524 | 229,545 |
| 1962 | 566,465 | 326,339 | 240,126 | 71,984 | 78,657 | −6,673 | 494,481 | 247,682 | 246,799 |
| 1963 | 576,951 | 426,767 | 150,184 | 71,188 | 78,645 | −7,457 | 505,763 | 348,122 | 157,641 |
| 1964 | 698,609 | 457,767 | 240,842 | 73,125 | 86,319 | −13,194 | 625,484 | 371,448 | 254,036 |
| 1965 | 791,737 | 489,503 | 302,234 | 75,580 | 76,799 | −1,219 | 716,157 | 412,704 | 303,453 |
| 1966 | 702,337 | 608,775 | 93,562 | 69,841 | 73,540 | −3,699 | 632,496 | 535,235 | 97,261 |
| 1967 | 398,403 | 604,211 | −205,808 | 68,105 | 76,317 | −8,212 | 330,298 | 527,894 | −197,596 |
| 1968 | 657,513 | 404,301 | 253,212 | 67,951 | 71,676 | −3,725 | 589,562 | 332,625 | 256,937 |
| 1969 | 980,731 | 436,685 | 544,046 | 71,165 | 68,021 | 3,144 | 909,566 | 368,664 | 540,902 |
| 1970 | 1,042,760 | 495,675 | 547,085 | 66,528 | 61,023 | 5,505 | 976,232 | 434,652 | 541,580 |
| 1971 | 936,349 | 554,280 | 382,069 | 65,612 | 54,022 | 11,590 | 870,737 | 500,258 | 370,479 |
| 1972 | 852,549 | 568,610 | 283,939 | 65,387 | 54,164 | 11,223 | 787,162 | 514,446 | 272,716 |
| 1973 | 932,583 | 580,019 | 352,564 | 63,474 | 53,208 | 10,266 | 869,109 | 526,811 | 342,298 |
| 1974 | 601,013 | 635,613 | −34,600 | 62,439 | 55,168 | 7,271 | 538,574 | 580,445 | −41,871 |
| 1975 | 429,064 | 652,966 | −223,902 | 62,969 | 52,861 | 10,108 | 366,095 | 600,105 | −234,010 |
| 1976 | 476,286 | 569,133 | −92,847 | 88,983 | 53,695 | 35,288 | 387,303 | 515,438 | −128,135 |
| 1977 | 522,611 | 505,696 | 16,915 | 99,766 | 53,603 | 46,163 | 422,845 | 452,093 | −29,248 |
| 1978 | 559,620 | 458,769 | 100,851 | 103,503 | 53,016 | 50,487 | 456,117 | 405,753 | 50,364 |
| 1979 | 649,832 | 419,091 | 230,741 | 104,645 | 53,083 | 51,562 | 545,187 | 366,008 | 179,179 |
| 1980 | 736,362 | 439,571 | 296,791 | 104,928 | 53,728 | 51,200 | 631,434 | 385,843 | 245,591 |
| 1981 | 605,629 | 470,525 | 135,104 | 104,491 | 55,001 | 49,490 | 501,138 | 415,524 | 85,614 |
| 1982 | 404,019 | 493,495 | −89,476 | 82,337 | 60,227 | 22,110 | 321,682 | 433,268 | −111,586 |
| 1983 | 354,496 | 487,268 | −132,772 | 81,244 | 62,355 | 18,889 | 273,252 | 424,913 | −151,661 |
| 1984 | 410,387 | 604,832 | −194,445 | 79,247 | 59,764 | 19,483 | 331,140 | 545,068 | −213,928 |
| 1985 | 480,872 | 425,313 | 55,559 | 82,653 | 58,607 | 24,046 | 398,219 | 366,706 | 31,513 |
| 1986 | 567,215 | 407,139 | 160,076 | 88,867 | 59,350 | 29,517 | 478,348 | 347,789 | 130,559 |
| 1987 | 591,765 | 398,518 | 193,247 | 119,429 | 64,534 | 54,895 | 472,336 | 333,984 | 138,352 |
| 1988 | 860,578 | 419,439 | 441,139 | 213,044 | 60,498 | 152,546 | 647,534 | 358,941 | 288,593 |
| 1989 | 1,133,794 | 539,832 | 593,962 | 366,849 | 101,750 | 265,099 | 766,945 | 438,082 | 328,863 |
| 1990 | 1,256,250 | 574,378 | 681,872 | 420,548 | 108,908 | 311,640 | 835,702 | 465,470 | 370,232 |
| 1991 | 1,198,978 | 596,455 | 602,523 | 273,633 | 98,915 | 174,718 | 925,345 | 497,540 | 427,805 |
| 1992 | 1,502,198 | 720,127 | 782,071 | 290,850 | 105,171 | 185,679 | 1,211,348 | 614,956 | 596,392 |
| 1993 | 1,277,408 | 815,312 | 462,096 | 287,561 | 104,653 | 182,908 | 989,847 | 710,659 | 279,188 |
| 1994 | 1,082,553 | 767,555 | 314,998 | 305,037 | 138,280 | 166,757 | 777,516 | 629,275 | 148,241 |
| 1995 | 1,096,048 | 698,113 | 397,935 | 303,347 | 130,672 | 172,675 | 792,701 | 567,441 | 225,260 |
| 1996 | 959,691 | 677,494 | 282,197 | 251,737 | 118,430 | 133,307 | 707,954 | 559,064 | 148,890 |
| 1997 | 840,633 | 746,969 | 93,664 | 225,335 | 109,903 | 115,432 | 615,298 | 637,066 | −21,768 |
| 1998 | 802,456 | 755,358 | 47,098 | 196,956 | 116,403 | 80,553 | 605,500 | 638,955 | −33,455 |
| 1999 | 874,023 | 672,048 | 201,975 | 200,150 | 116,410 | 83,740 | 673,873 | 555,638 | 118,235 |
| 2000 | 841,158 | 674,038 | 167,120 | 191,909 | 111,244 | 80,665 | 649,249 | 562,794 | 86,455 |
| 2001 | 879,217 | 606,494 | 272,723 | 193,958 | 109,507 | 84,451 | 685,259 | 496,987 | 188,272 |
| 2002 | 842,543 | 623,255 | 219,288 | 184,202 | 117,683 | 66,519 | 658,341 | 505,572 | 152,769 |
| 2003 | 768,975 | 626,330 | 142,645 | 167,216 | 127,267 | 39,949 | 601,759 | 499,063 | 102,696 |
| 2004 | 780,175 | 697,632 | 82,543 | 177,993 | 150,667 | 27,326 | 602,182 | 546,965 | 55,217 |
| 2005 | 707,352 | 628,399 | 78,953 | 128,051 | 144,815 | −16,764 | 579,301 | 483,584 | 95,717 |
| 2006 | 661,855 | 639,064 | 22,791 | 103,388 | 155,290 | −51,902 | 558,467 | 483,774 | 74,693 |
| 2007 | 680,766 | 636,854 | 43,912 | 106,014 | 161,105 | −55,091 | 574,752 | 475,749 | 99,003 |
| 2008 | 682,146 | 737,889 | −55,743 | 108,331 | 174,759 | −66,428 | 573,815 | 563,130 | 10,685 |
| 2009 | 721,014 | 733,796 | −12,782 | 114,700 | 154,988 | −40,288 | 606,314 | 578,808 | 27,506 |
| 2010 | 798,282 | 670,605 | 127,677 | 114,752 | 141,000 | −26,248 | 683,530 | 529,605 | 153,925 |
| 2011 | 958,299 | 678,969 | 279,330 | 116,604 | 140,132 | −23,528 | 841,695 | 538,837 | 302,858 |
| 2012 | 1,080,936 | 711,991 | 368,945 | 115,028 | 133,232 | −18,204 | 965,908 | 578,759 | 387,149 |
| 2013 | 1,226,493 | 797,886 | 428,607 | 118,425 | 140,282 | −21,857 | 1,108,068 | 657,604 | 450,464 |
| 2014 | 1,464,724 | 914,241 | 550,483 | 122,195 | 148,636 | −26,441 | 1,342,529 | 765,605 | 576,924 |
| 2015 | 2,136,954 | 997,552 | 1,139,402 | 120,713 | 138,273 | −17,560 | 2,016,241 | 859,279 | 1,156,962 |
| 2016 | 1,865,122 | 1,365,178 | 499,944 | 146,047 | 281,411 | −135,364 | 1,719,075 | 1,083,767 | 635,308 |
| 2017 | 1,550,721 | 1,134,641 | 416,080 | 166,703 | 249,181 | −82,478 | 1,384,018 | 885,460 | 498,558 |
| 2018 | 1,585,112 | 1,185,432 | 399,680 | 201,531 | 261,851 | −60,320 | 1,383,581 | 923,581 | 460,000 |
| 2019 | 1,558,612 | 1,231,552 | 327,060 | 212,669 | 270,294 | −57,625 | 1,345,943 | 961,258 | 384,685 |
| 2020 | 1,186,702 | 966,451 | 220,251 | 191,883 | 220,239 | −28,356 | 994,819 | 746,212 | 248,607 |
| 2021 | 1,323,466 | 994,303 | 329,163 | 183,650 | 247,829 | −64,179 | 1,139,816 | 746,474 | 393,342 |
| 2022 | 2,665,772 | 1,203,683 | 1,462,089 | 184,753 | 268,167 | −83,414 | 2,481,019 | 935,516 | 1,545,503 |
| 2023 | 1,936,754 | 1,284,570 | 652,184 | 191,270 | 270,598 | −79,328 | 1,745,484 | 1,013,972 | 731,512 |
| 2024 | 1,697,192 | 1,278,425 | 418,767 | 188,982 | 276,161 | −87,179 | 1,508,210 | 1,002,264 | 505,946 |
| 2025 | 1,481,299 | 1,259,258 | 222,041 | 191,741 | 295,193 | -103,452 | 1,289,558 | 964,066 | 325,492 |
Education
Main article: Education in Germany
Education in Germany is mostly managed by each state, but there have been efforts to create more unified school systems. One popular idea is the Gesamtschule, a type of school that combines different levels of learning together. Students can choose to study in companies as well as attend vocational schools through a program called Duale Ausbildung.
Children can attend optional kindergarten from ages three to six, and then must go to school for at least nine years. Primary school usually lasts four years. After that, students can go to different types of schools depending on their abilities. The Gymnasium prepares students for university, the Realschule is for intermediate students, and the Hauptschule focuses on vocational training. There are also Gesamtschule schools that welcome all students and offer different levels of classes depending on each student's needs.
Most people in Germany can read and write, but some younger people struggle with understanding texts. This varies depending on their background and family situation.
| Year | Hauptschulabschluss | Realschulabschluss | Abitur |
|---|---|---|---|
| 1970 | 87.7% | 10.9% | 1.4% |
| 1982 | 79.3% | 17.7% | 3% |
| 1991 | 66.5% | 27% | 6.5% |
| 2000 | 54.9% | 34.1% | 11% |
Health
Main article: Health in Germany
People in Germany live to an average age of about 81 years. Health problems like heart disease and cancer are common reasons people get very sick. Many grown-ups in Germany smoke cigarettes, and some have more weight than is healthy for them.
Religion
Main article: Religion in Germany
Germany’s constitution guarantees freedom of faith and religion. People in Germany have different beliefs. Many people follow Christianity, which is the largest religion there. Smaller groups include Judaism, Buddhism, and Hinduism.
Over time, fewer people have been joining big Christian churches like the Roman Catholic Church and the Protestant Church. Today, almost half of all Germans do not follow any particular religion. People in Germany also speak many different languages at home, with German being the most common. Other languages spoken at home include Turkish, Russian, Arabic, English, and Polish.
Images
Related articles


This article is a child-friendly adaptation of the Wikipedia article on Demographics of Germany, available under CC BY-SA 4.0.
Images from Wikimedia Commons. Tap any image to view credits and license.